Canon lenses- Resolution Versus Aperture

When Reikan Technology’s FoCal application was recently updated to provide support for the Canon EOS R, it opened up a whole new avenue to test lenses for aperture sharpness. Since the EOS R is mirrorless, and its focusing pixels are embedded in the imaging sensor, it does not require a micro-focus adjustment. Now both Canon EF and RF lenses can be tested for center resolution on the same camera for meaningful comparison without the deleterious influence of micro-focus adjustment inaccuracy.

Accordingly, I tested 11 different Canon lenses that were introduced at various times from 1989 through 2018. To accomplish this, the FoCal test target was photographed at a constant distance of 12 feet, illuminated by a constant ancillary light source. The lenses were all attached to the EOS R camera mounted on a Really Right Stuff BH55 ball head mounted on a Gitzo GT3541XLS carbon fiber tripod. The aperture sharpness application stepped each lens’s aperture in 1/3 stop increments over its entire range, as well as adjusting the shutter speed to keep the exposure constant while also tripping the shutter. When this was finished, the software measured the resolution of each image and assembled the results into a report.

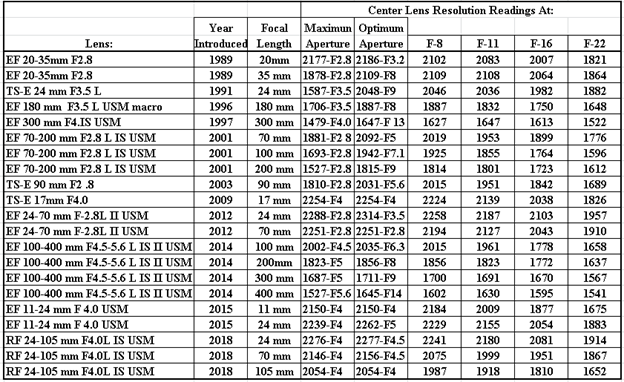
The resolution measurements at maximum aperture, optimal aperture, F8, F11, F-16, and F-22 were extracted from the lens reports. These were assembled into focal length groups for comparison, making it easier to see which of the lens tested at a given aperture would better fulfill quality needs:

With the exception of the EF 20-35mm F2 .8 lens at 20 mm, most lenses tested here made prior to 2009 required being stopped down several stops in order to reach their optimum resolution aperture. Since then, we see that more current design lenses are sharp wide open, or at most one stop down. Unfortunately, however, this does not apply to the EF 100 – 400 mm F4 .5-5.6 L IS II lens at tested focal length settings beyond 100 mm. But, interestingly enough, this zoom lens at 300 mm was sharper across the aperture range than the older fix focal length 300 mm F4 IS USM lens. Of all the lenses tested the EF 24-70 mm F2.8L II USM was the sharpest among the lens tested both wide open and at F-22 and at both focal length extremes. The table below shows all the aperture sharpness test results by lens grouping for easier comparisons that way:


Unfortunately, the FoCal aperture sharpness test only measures the center sharpness of a lens. I have contacted Reikan Technology and requested that they also provide a test chart and the means to measure lens edge aperture sharpness. They have indicated that they would consider it, but so far nothing has happened. That said, it is worth noting that the edge sharpness of the Canon RF 24-105 mm F4 IS USM is visually superior to other lenses I have looked at briefly using the USAF – 1951 test targets. This is a confirmation of the RF lens series edge sharpness superiority reported elsewhere.

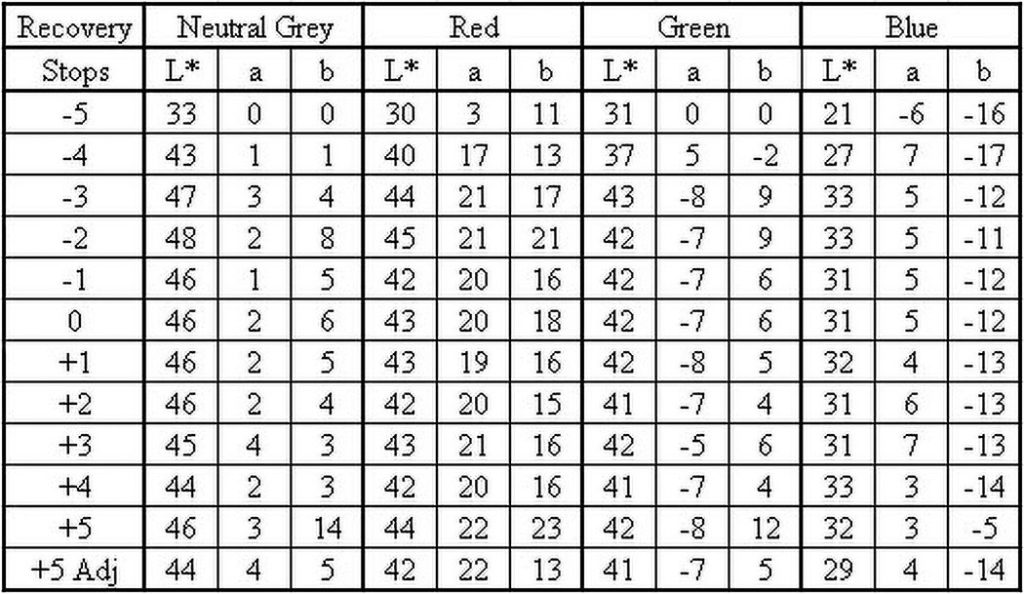
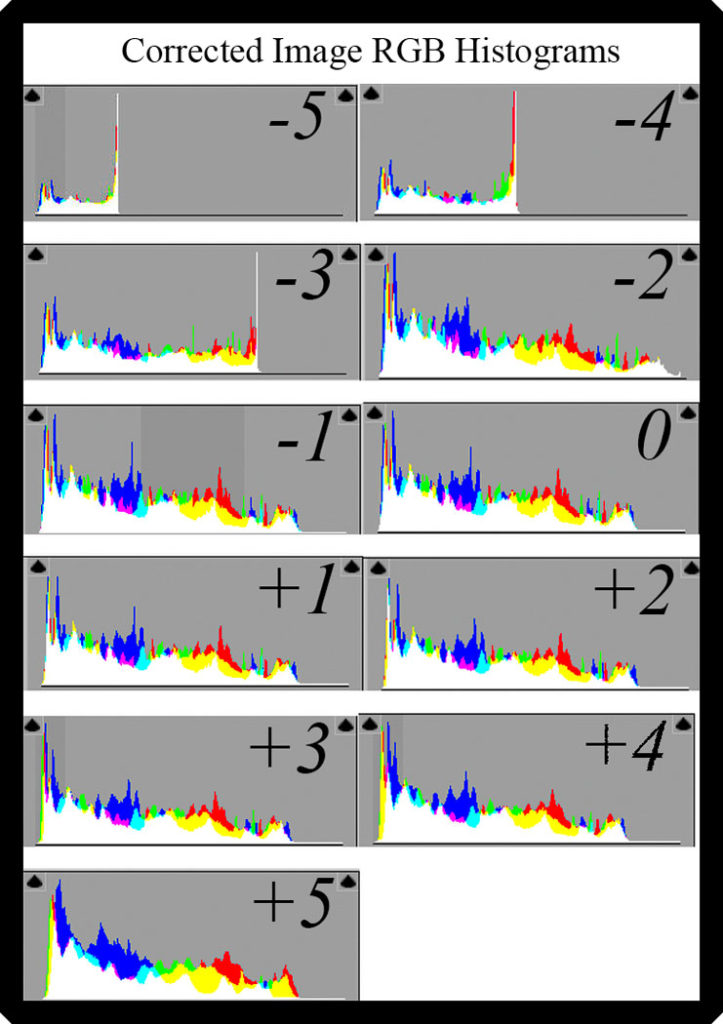
All this said, when it comes to visually evaluating reasonable size prints made with any of these lenses, it would be difficult to tell the difference for most subjects, even with a side-by-side comparison. However, when you start to take into consideration things like cropping, larger prints made therefrom could suffer. So play it safe and choose higher sharpness lenses were possible. Since setting the desired aperture doesn’t always result in the optimum exposure when photographing a given subject, check out how much under or overexposure recovery is possible here.

Posted in Blog, Photo Topics, Tech Talk | Tagged , , , , , | Comments Off on Canon lenses- Resolution Versus Aperture

Noise Reduction – Canon EOS R

I recently purchased a Canon EOS R and noticed that there were provisions there for high ISO noise reduction, just as there were in my previous Canon 5D MK III and 5D MK IV cameras. As I had never used the feature before, I decided to give it a try this trip around, given that noise increases directly with increasing ISO. Accordingly, the EOS R was mounted on a tripod and the scene was photographed in RAW format at ISO 100, using the new Canon 24 – 105, F-4.0, RF lens set to 105 mm. To further ensure the stability of the setup, all the exposures were made using a CamRanger to remotely trigger the shutter. A black box surround on the image below indicates the cropped portion that was used to make the comparisons that follow:

The Canon EOS R provides four settings for high ISO noise reduction: Off, Low, Std. and Hi. So a series of photographs were taken using each of these settings at ISO 12,800, ISO 40,000, and ISO 102,400. Images that were subject to noise reduction in the camera were then brought into Canon DPP, Canon Digital Photo Professional, for processing. Here the noise reduction was immediately applied to the CR3 raw files as they were imported. Importation into DPP was necessary as the in-camera “noise reduced” RAW images imported directly into Adobe Camera RAW had no noise reduction applied. The “Off” in-camera RAW files were entered into Adobe Camera Raw 11.2.1 where noise reduction was applied using the Luminance and Luminance Detail sliders; the color noise settings were left unchanged from the ACR default values. The resulting images were converted to TIFF files (ProPhoto RGB color space; 16 bit; 6720×3380 (30.1mp); 300ppi). All of the resultant TIFF files were opened directly into Photoshop 2019, then cropped as indicated above and assembled for comparison.  The final assemblage was then lightened in Photoshop to make the comparisons easier to see. See the assembly below:

From my read, the ACR processed images show more detail, better contrast, and lower color shift than any of the in-camera noise-reduced images. The least damaging of the in-camera noise reduced appears to be the Low 12,800 image. But even that image does not seem to fare as well as the ACR noise reduced image. However, if you shoot JPG’s for use as-shot rather than running the conversion from RAW’s to JPG in Photoshop, then Canon’s in-camera noise reduction would certainly be of benefit. For more on the subject of noise, go here.

Posted in Blog, Photo Topics, Tech Talk | Tagged , , , , | Comments Off on Noise Reduction – Canon EOS R

Color Gamut – Epson Ultrachrome K3 vs HD Inks

I recently purchased an Epson SureColor P800 desktop printer.  Since it features the new 8-color Ultrachrome HD inks that are claimed to have a wider color gamut [the entire range of colors that can be produced by a given device] and print darker blacks, I couldn’t wait to test them against the older 8-color Ultrachrome K3 inks of my Epson Stylus PRO 7800 large format printer.

Epson Ultra-Premium Photo Paper Luster was chosen for the test print medium, as it is a good representative of the “glossy” type photo papers, which have a much wider color gamut that matte photo papers. Printer profile targets were generated by each printer printing 729 color patches generated by Monaco Proof 3.7.0 profiling software.  After being allowed to dry overnight, the color patches were measured with an i1 spectrophotometer.  Monaco Proof then generated the color profile for each set of prints.

For the analysis, the profiles were entered into Color Think Pro 3.0.3 set to display in L*ab mode. The RGB color mode is fine for many things, but its primary disadvantage is that luminance is confounded with saturation. L*ab mode solves this problem by making luminance a separate channel. The L channel has a value of 0, dark, to 100, bright. The a channel (Green – Magenta) runs from -128 to +127, while the b channel (Blue – Yellow) runs from -128 to +127. Higher values of either the a or b channel, either positive or negative, indicate a higher degree of color saturation.  Thus middle or neutral grey has an Lab value of 50, 0, 0.

Based on several sets of measurements, the gamut volume of the HD inks exceeds that of the K3 inks by approximately 8-10%.  The 3 dimensional graphs below also show the 2 dimensional projections of the two color gamuts. The HD ink color gamut is shown in color, while the K3 ink color gamut is shown as black to make the difference clearer.

Epson Ultrachrome K3 vs HD Inks

As can be seen, the new HD inks do indeed have a significantly increased magenta- blue gamut, while orange – yellow is slightly increased.  The black splotches of the K3 inks in the 3D plots can be seen slightly exceeding the gamut of the HD inks in some areas. Otherwise, the K3 ink gamut is seen as residing inside the gamut of the HD inks as a darker area of colors. So what does all this mean?

That question deeply depends on what subjects you are trying to print. For most things, it would be difficult to see the difference, except perhaps by a side-by-side comparison. To try to illustrate this, I printed a copy of Digital Outback Photo’s Printer Evaluation Image V002, seen below, using both printer inks onto Epson Ultra-Premium Photo Paper Luster.

Outback Photo’s Printer Evaluation Image V002

Visually I could not see a real difference between the images produced by the HD and K3 ink sets except for the slight increase in saturation of the left strawberry of the comparison shown below.

Printed Image Comparison

 As to the blacks, a comparison of the luminance values of the RGB 2, 2, 2 patches at the bottom of the printer evaluation image was made using the i1 spectrophotometer and Babble Color CT&A. It showed only a 1.3% darker and slightly more neutral patch for the HD inks [in RGB 15,15,16 vs 16,17,18 for the K3 inks]. The smaller and lighter K3 ink square is contained in the larger HD ink square. See if you can see it!

Babble Color color comparison

 So, should you run out and buy a new Epson printer just because of the new Ultrachrome HD ink set. I don’t think so. However, the new HD inks have been shown to provide 2X the fade resistance of the K3 ink along with reduced bronzing. If you are buying or intend to buy a new printer at some point, knowing that the HD ink set is better able to handle anything you’re likely to throw at it to print photography is comforting. However, if you make photographic copies of oil paintings that have highly saturated colors, are making prints for advertising or other such subjects that demand high the highest color accuracy, then you should consider the 10-color HDX ink set.

Posted in Blog, Photo Topics, Tech Talk | Tagged , , , , , , , , | 2 Comments

Noise Test – Canon 5D Mk IV

In a previous post, Exposure Recovery-How Much Is Possible, we explored the result of under and over exposing an image at ISO 400 by 5 stops without any adjustment.  Then we looked at the result of trying to recover these  images using the exposure tool in Adobe Camera Raw. That study however did not cover the attendant issue of image noise.

The first approach to shed light on the noise issue was to extract the properly exposed brown patch of the Macbeth Color Checker along with the 5 recovered underexposed images. These were then composited together and their luminescence was increased to bring out the noise. This can be seen in the image immediately below:

Noise vs Underexposure


Careful examination shows that both luminance and chroma noise starts to become noticeable in the -3 stop underexposure, and gets worse as the underexposure increases. While it is usually possible to mitigate chroma noise with little negative effects using image processing software such as Lightroom and Photoshop, reducing noise thereby usually results in a loss of sharpness. Since the degree to which such tools are used or not used is a judgment call that is specific to a given image, it was not considered further.

Is a well-known fact that the use of higher ISO camera settings will at some point result in visible image noise. The dark end of high dynamic range images frequently suffers because the exposure is reduced in an attempt to avoid  blown-out  highlights. Attempts to recover the shadow details in such images  frequently result in increased image noise. So to get a feel for the magnitude of the noise problem, the test subject below was photographed in one stop increments from ISO 100 to ISO 32,000. The red square resting on the top shelf of the photograph below indicates the location from which the 100% image crops were taken for the studies that follow:

Test target


When exposed at the camera metered nominal exposure, inspection of the resulting images showed them to be essentially noise free up to ISO 3200. Beyond that however, noise started to creep in and steadily increased to ISO 32,000. This can be seen below:

Noise vs ISO at Nominal Exposure


We saw previously in, Exposure Recovery-How Much is Possible, that it appeared that a 3 stop underexposure at ISO 400 could  successfully be recovered. So to see how well this would apply over a range of ISOs, the photographic test subject was again photographed from ISO 100 to ISO 32,000 with a 3 stop underexposure. Image crops were taken as above and corrected in Adobe Camera Raw using the exposure tool to apply a 3-stop exposure increase. The results can be seen below:

Noise vs ISO for Corrected 3 Stop Underexposed Images


From this it appears that noise starts to be faintly noticeable at ISO 400 increasing mildly to ISO 1600. At ISO 3200 noise may be correctable, but the image quality beyond that would likely suffer serious noise consequence.

While “exposed to the right” can be used to avoid noise in the shadows, particularly at higher ISO settings, it also invites the possibility of highlight clipping which we have previously seen occurs at around a 2 stop overexposure at ISO 400. Compounding difficulties is the fact that the meter found in DSLR camera viewfinders only measures luminance for an average neutral gray for the scene, and does gives no warning regarding clipped highlights or clipped colors. Using live view to display a histogram improves matters, but most cameras only provide a choice of looking at the luminance histogram or the color histogram. So while the luminance histogram may indicate that highlights will not be clipped, it is still possible that some colors may, and vice versa. How important is this? Well it depends on what your photographic intention is and what you are photographing. Sometimes it pays to clip the highlights – particularly for things like streetlights in a night scene. At other times it pays to slightly underexpose in order to preserve details in the highlights.

Given that the Canon 5D Mk IV is representative of the current state of DSLR technology, what have we learned from all this? Simply, that images or parts of images receiving a 3-stop underexposure appear to be successfully recoverable up to approximately ISO 1600 without incurring excessive noise. Hopefully these studies will better enable you to        pre-visualize the results to be expected from the range of ISO and exposure bias you may choose to apply when a photographic subject presents itself.

Posted in Blog, Photo Topics, Tech Talk | Comments Off on Noise Test – Canon 5D Mk IV

Exposure Recovery – How much is possible?

 In a previous post, Dynamic Range Test – Canon 5D MK IV, we illustrated that 8 stops appears to be the practical dynamic exposure range of a current well-regarded DSLR camera. Now we wish to take a look at what that might mean visually for images that you may take.

For this test series a Canon 5D Mk IV set to ISO 400 was used with a Canon EF 100-400 mm F4 .5-5.6L IS II USM lens set to 135 mm at F8 to photograph a Macbeth Color Checker chart set up on a bookcase. Once the “0” exposure was determined, it was varied +/- 5 stops in one stop increments by varying the exposure time. Focus was held constant by switching off autofocus on the lens. See the chart below that shows the 11 exposures taken:

+/- 5-Stop Exposure Bracket


As can be seen, at +/- 1 stop around neutral, things don’t look too bad. +/- 2 stops however appears to be pushing it, and anything beyond that looks hopeless! But we do after all have Camera Raw, and if you shoot your photographs in RAW (which you should if you wish to obtain maximum image quality) you may have a chance of being able to rescue mal-exposed images. But the real question is what will be the resultant quality?

To effect the recovery, the 11bracket images were brought from Adobe Bridge CC into Adobe Camera Raw. There the exposure slider was moved in one stop increments in the opposite direction of the 1-stop exposure bias increments given to the test images. These files were then moved into Photoshop CC 2018 where the neutral gray, red, green, and blue Macbeth Color Checker patches were measured with the eyedropper tool set to L*ab measuring mode and a 101 x 101 pixel average sample size. The chart below shows the results:

+/- 5-Stop Exposure Bracket Recovery Data

The data shows that, numerically, it appears possible to satisfactorily recover images that were overexposed by 3 stops to being underexposed by 4 stops. However, the 5-stop underexposed image had a yellow color cast. An attempt was made to correct this by numerically matching the neutral grey patch L*ab reading of this image as closely as possible with that of the neutral exposure. This was done by converting the file into L*ab mode and applying a -3 Magenta and -37 Blue correction using the color balance tool. The file was then converted back to RGB mode. However, while this move did indeed improve the overall color balance of the -5 stop image, it was visually apparent that the color balance in other parts of the image still did not properly match the reference “0” exposure. So while a 5-stop under exposure rescue may work in some instances, its circumstances should be avoided.

The corrected file results, below, go left-to-right from the 5-stop over exposure (top left) to the corrected 5-stop under exposed color balance corrected exposure (bottom right). The visual result appears at first glance to confirm the earlier numerical result:

Corrected +/- 5-Stop Exposure Bracket


But is that the whole story? Close inspection of the corrected image RGB histograms, below, which plot number of pixels vs luminosity, tells us a slightly different story. The -5 and -4-stop histogram luminance ranges are severely truncated and colors are clipped and missing. The -3-stop histogram shows a truncated luminance range. The result visually in this case is slightly desaturated color.  The -2-stop image is a bit of a surprise, as the stretched luminance range exceeds that of the reference image. This is at the expense of some highlight clipping and color shift which accentuates of some colors. If you look at the white background of the USAF 1951 Test Target, you can see that it is brighter here than in the other corrected images, and that some of the colors of the Macbeth chart are slightly brighter, particularly yellow. The -1 to +2-stop correction histograms closely resemble the “0” reference. Surprisingly, the +3 and +4-stop correction histograms show the correct luminance range, but at the expense of slightly duller colors. The -5-stop correction on the other hand shows significant color shift; and, as we have seen, is not totally correctable.

Corrected-Image RGB Histograms

In many articles and books on photography these days one often sees the advice to “expose to the right”. In other words, bias your exposure toward “over exposure” without clipping the histogram. This is good advice, particularly if you are shooting at high ISO’s, as this practice helps lower image noise. But, as we have seen here, this needs to be done with caution, as there appears, from this study at least, that there is less latitude for correction on the over exposure side than the underexposure side. This subject of image noise will be dealt with in an upcoming post, Noise Tests – Canon 5D Mk IV. Here the subject of noise vs ISO for nominaly exposed images is explored as well those recovered from a 3-stop underexposure.

Posted in Blog, Photo Topics, Tech Talk | Tagged , , , , , | Comments Off on Exposure Recovery – How much is possible?