
One problem that photographers frequently face when trying to a capture an image of the scene before them is that the brightness range frequently exceeds the dynamic range of their camera to capture the total range of brightness values. While there are various ways to deal with this problem such as exposure bracketing and later blending together using HDR (high dynamic range) software, or choosing to sacrifice the shadows in order to preserve the highlights; cameras capable of wide dynamic range are obviously desirable.
To that end, DxOMark has measured the dynamic range of many cameras based on signal-to-noise ratio measurements. Their result for the Canon 5D Mk IV at ISO 100 is 13.6 stops. However, some articles have recently claimed that the dynamic range of DSLR cameras these days is closer to 8 stops. Accordingly, I decided to conduct my own test.
A Kodak gray card filling the whole frame was photographed using a Canon 5D Mk IV camera set at ISO 100 mounting a Canon EF 24 – 70 mm F2 .8L II USM lens set the F2 .8. Once focus was obtained the autofocus was turned off and the exposure was adjusted until the value was centered in the metering scale. Then the exposure was increased 5 stops by adjusting the shutter speed, and a RAW photo was recorded. As the exposure was progressively decreased in one stop increments, photos were recorded until -5 stops was achieved.
The photographs were brought into Adobe Bridge CC 2018 set to ProPhoto RGB; 16 bit, and opened without adjustment in Adobe Photoshop CC 2018 for measurement. The L* values at the center of each photograph were measured using the Eyedropper Tool set to a 101 x 101 pixel average. The data were then entered into an Excel spreadsheet from which a graph was constructed showing L* (Luminance) versus exposure stops, see below:
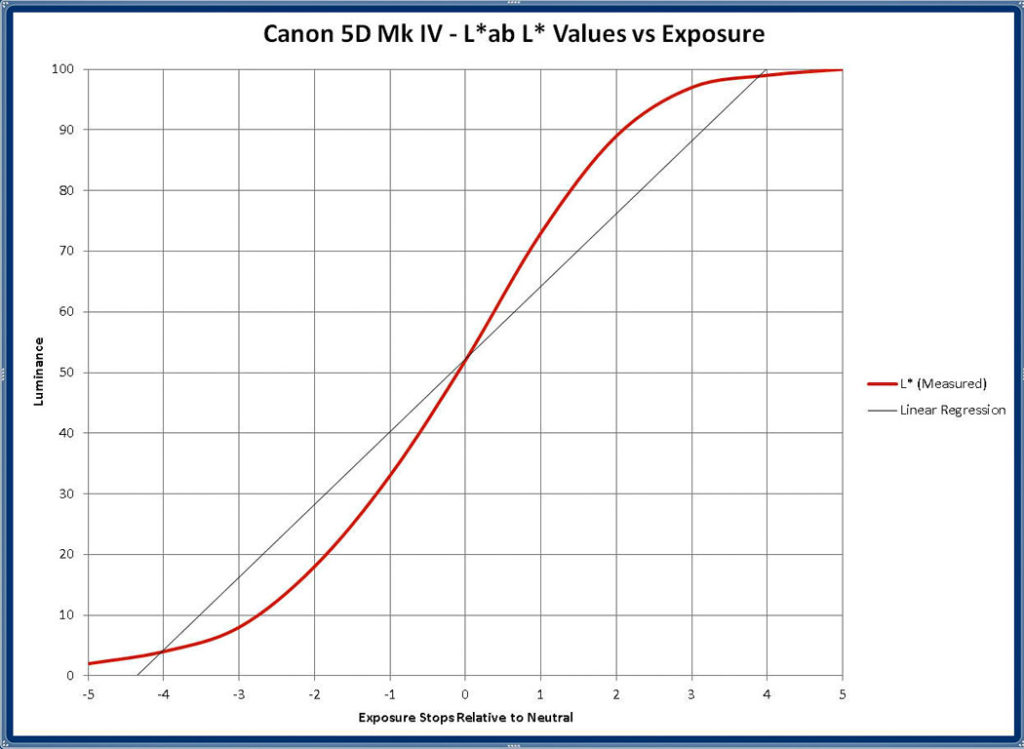
As can be seen, the L* curve is not linear as exemplified by the black linear regression line that accompanies it. So what does this all mean? First, it shows heightened contrast for the first 6 stops surrounding zero. After that, the contrast becomes compressed at both ends of the scale. So from this, it looks as though the practical usable dynamic range lies around +/- 4 stops. After that things rapidly approach pure white at the high end of the range, while at the low end of the range we approach pure black.
So we confirm the 8 stop usable dynamic range findings of others. But what does this really all mean for our photographs? That is a question that we answer in Exposure Recovery – How Much is Possible?